St John's Church Road
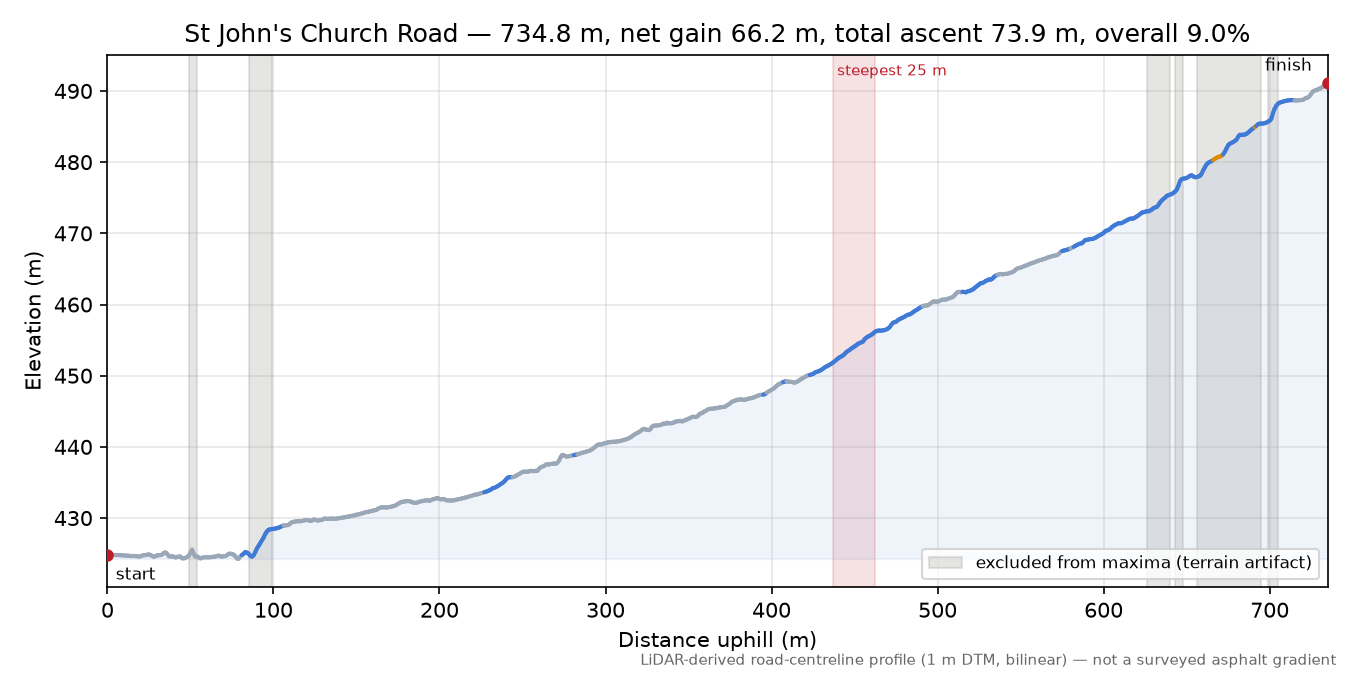
734.8 m · net rise 66.2 m · total ascent 73.9 m · overall 9.0% · evidence quality U (needs confirmation) · South Kona · Hawaii · share
Shape: sustained — 36% of the climbing sits in a quarter of the distance; longest continuous stretch at 10%+ is 63 m.
Found purely from mapping and LiDAR data, and not yet matched against books, race records or lists — it may be well known to locals under a name we've never heard. It was cross-checked against the state road inventory, OpenStreetMap and the point-cloud evidence for a graded road bed, but a discovery can still be an artifact of the terrain model or the map. Treat it as a well-evidenced hypothesis until someone has ridden it. If you know this road, tell us what you found — photographs, corrections and local knowledge all welcome; the map links below let you scout it first.
needs review texture unresolved — treat short-window maxima here as provisional.
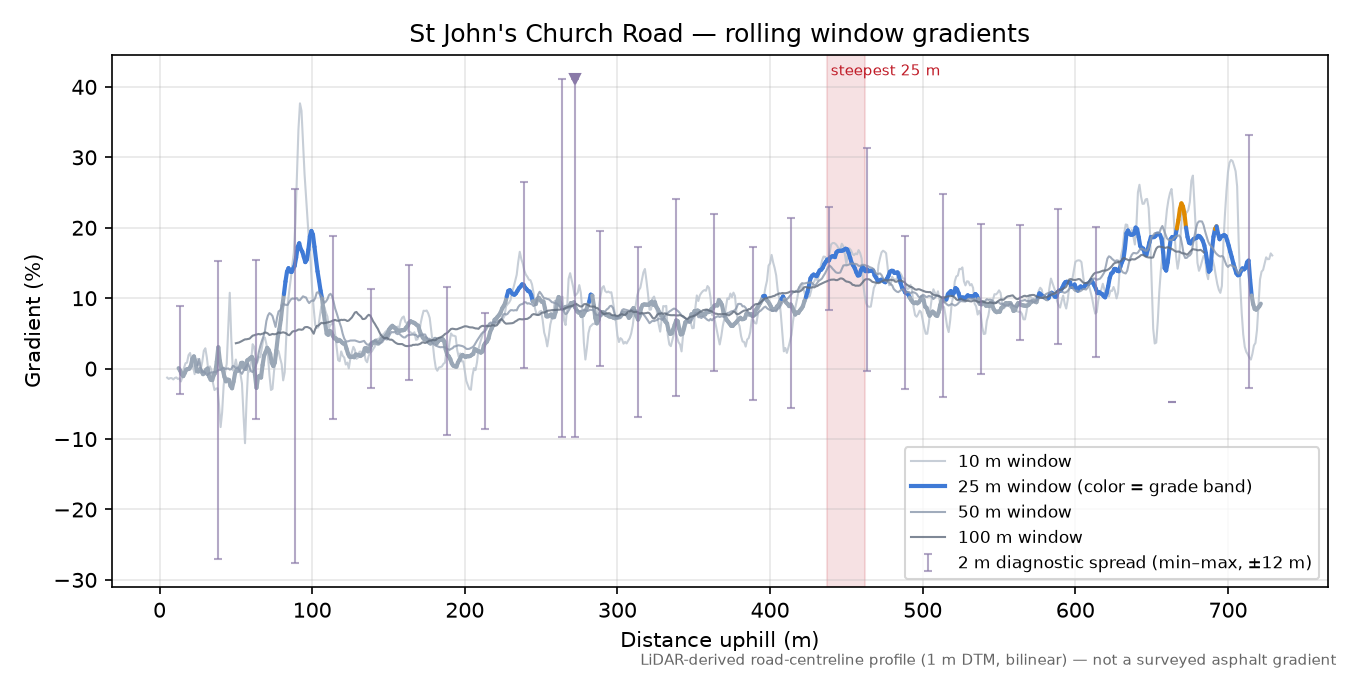
Gradient ladder what do windows mean?
| Window | Maximum | Located at | |
|---|---|---|---|
| 2 m (diagnostic) | ≈41% | 271–273 m | under overhead cover terrain reads 70.8% at 701–703 m across a structure — excluded |
| 3 m (diagnostic) | ≈37% | 271–274 m | under overhead cover terrain reads 61.1% at 701–704 m across a structure — excluded |
| 5 m | ≈24% | 269–274 m | under overhead cover terrain reads 47.9% at 700–705 m across a structure — excluded |
| 10 m | ≈18% | 437–447 m | under overhead cover terrain reads 37.7% at 87–97 m across a structure — excluded |
| 20 m | ≈17.4% | 437–457 m | under overhead cover terrain reads 23.8% at 658–678 m across a structure — excluded |
| 25 m | ≈17.0% | 437–462 m | under overhead cover terrain reads 23.5% at 657–682 m across a structure — excluded |
| 50 m | ≈14.9% | 429–479 m | under overhead cover terrain reads 20.9% at 657–707 m across a structure — excluded |
| 100 m | ≈12.8% | 396–496 m | under overhead cover terrain reads 17.3% at 605–705 m across a structure — excluded |
may continue beyond end Extent detection suggests reviewing where this climb starts/ends.
Map
Check this route yourself: Google Maps route via their router · Street View at the base where coverage exists · geojson.io our exact measured line · OpenTopoMap
This climb's data: OCL JSON — the full gradient ladder, quality flags and provenance in the OpenClimb Ladder format.
Surface: paved throughout, according to each state's road inventory.
Access: Listed 2026-09-11 (texture re-measure): with the step masked the steepest 25 m reads 17.0 %, below the ranking door — kept as a listed page.
Measured, not vetted. This page records what the laser record shows about the road's shape — nothing more. Nobody has necessarily ridden or inspected this road for the survey, and a page here is not a recommendation and no guarantee that the road is open, surfaced, rideable or safe. Gates, private sections, missing rights of way and hazards do not show up in elevation data. Check access and conditions on the ground and make your own judgment.
Ridden it, or know better? Submit data for this climb no account needed · Share this climb
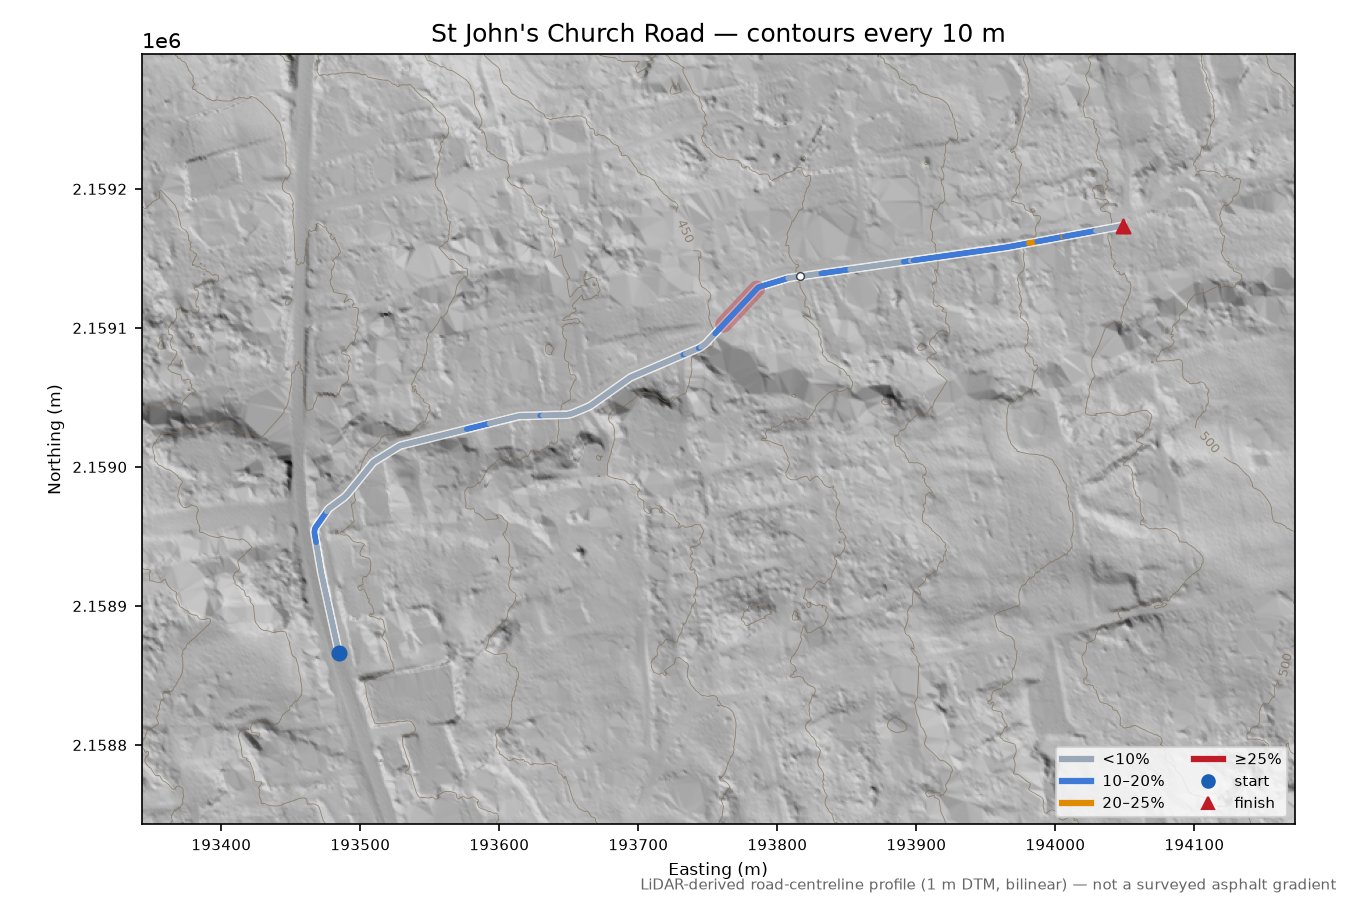
Route colour = gradient over a 25 m window: <10% 10–20% 20–25% ≥25%
© OpenStreetMap contributors · topo tiles © OpenTopoMap (CC-BY-SA) · vector tiles OpenFreeMap · aerial imagery USGS (public domain)
Profile
The map, profile and gradient chart share one position — move your pointer over them and the marker follows. Colors are the gradient bands; the shaded span is the steepest 25 m. Any 25 m figure is good to about a point either way (why).
Measurement card
| Elevation | USGS 3DEP (The National Map) — USGS 3DEP 1 m DEM, HI_Hawaii_Island_Lidar_NOAA_2017_B17 (collected 2017) |
|---|---|
| Resolution / CRS | 1.0 m grid, EPSG:26905; sampled every 1.0 m, bilinear interpolation |
| Tiles | x19y216 |
| Road centreline | OpenStreetMap (local PBF extract), snapshot 2026-09-07T20:21:20Z |
| Quality status | evidence quality U; review flags: texture unresolved |
| Analysis | OCL 0.1.0, analysis 0.1.0, run texture-us-hi-260911, calculated 2026-09-11 |
Provenance
{
  "analysis_version": "0.1.0",
  "sample_interval_m": 1.0,
  "interpolation": "bilinear",
  "smoothing": "none",
  "gradient_windows_m": [
    5.0,
    10.0,
    20.0,
    25.0,
    50.0,
    100.0
  ],
  "diagnostic_windows_m": [
    2.0,
    3.0
  ],
  "elevation_crs": "EPSG:26905",
  "elevation_resolution_m": 1.0,
  "elevation_tiles": [
    "data/cache/usa/hi-east/USGS_1M_5_x19y216_HI_Hawaii_Island_Lidar_NOAA_2017_B17.tif"
  ],
  "calculated_at": "2026-09-11T23:12:23+00:00",
  "road_source": "OpenStreetMap (local PBF extract)",
  "road_attribution": "\u00a9 OpenStreetMap contributors, ODbL",
  "osm_pbf_path": "data/cache/pbf/hawaii-2026-09-08-batch.osm.pbf",
  "osm_snapshot": "2026-09-07T20:21:20Z",
  "run_id": "texture-us-hi-260911",
  "elevation_provider": "USGS 3DEP (The National Map)",
  "elevation_licence": "Public domain \u2014 USGS 3DEP 1 m DEM, courtesy of the U.S. Geological Survey",
  "elevation_dataset": "USGS 3DEP 1 m DEM, HI_Hawaii_Island_Lidar_NOAA_2017_B17 (collected 2017)",
  "elevation_tile_ids": [
    "x19y216"
  ],
  "climb_origin": "discovered",
  "canopy_check": "unavailable \u2014 no surface model (DSM or point cloud) registered for this coverage",
  "license": "ODbL-1.0",
  "license_url": "https://howsteep.org/licensing"
}