Gifford to Newlands Hill°
7483.3 m · net rise 276.8 m · total ascent 344.5 m · overall 3.7% · evidence quality U (needs confirmation) · Gifford · East Lothian · share
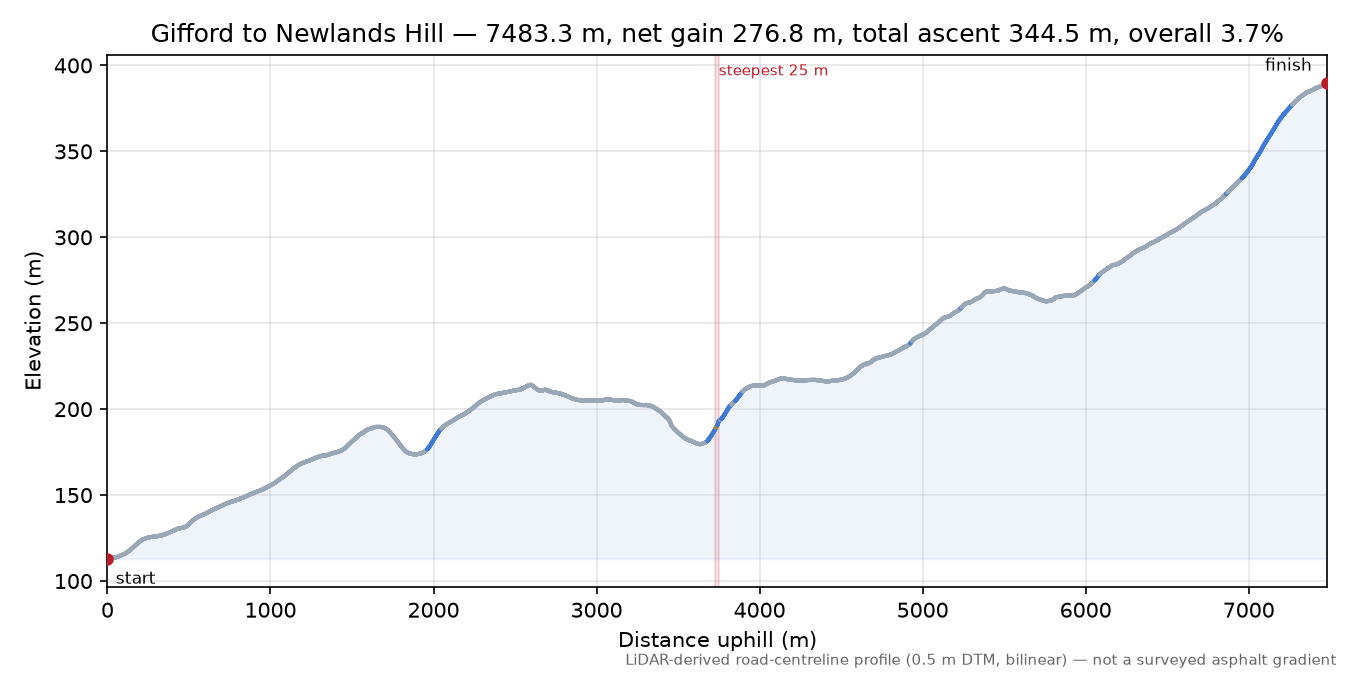
Shape: sustained — 37% of the climbing sits in a quarter of the distance; longest continuous stretch at 10%+ is 279 m.
Documented on the ground — sign: 17% (2025). Signs get repainted and tags get retagged, so the date is part of the fact; not yet matched against any cycling list.
° The name is provisional: this climb is not yet matched to a documented name, so it was named from nearby map places. There is no evidence of local usage — (auto-named from gazetteer (hypothesis, unreviewed); discovered as 'Discovered lane (55.8970, -2.6938)'). Corrections welcome.
needs review short window divergence — treat short-window maxima here as provisional.
≈ Overhead cover (tree canopy or structures) spans 13% of this route — detected by comparing the surface model (DSM, treetops and rooftops) against the terrain model (DTM, bare ground). Under cover the bare-ground model is built from fewer laser returns, so metre-scale readings can wobble; maxima whose window sits in a covered zone are marked ≈ below — less certain — the flag does not say whether the true value is higher or lower. Longer windows average over more clean ground and are steadier.
Gradient ladder what do windows mean?
| Window | Maximum | Located at | |
|---|---|---|---|
| 2 m (diagnostic) | ≈42% | 3745–3747 m | under overhead cover |
| 3 m (diagnostic) | ≈40% | 3745–3748 m | under overhead cover |
| 5 m | ≈35% | 3743–3748 m | under overhead cover |
| 10 m | ≈27% | 3738–3748 m | under overhead cover |
| 20 m | ≈22.2% | 3729–3749 m | under overhead cover |
| 25 m | ≈21.1% | 3724–3749 m | under overhead cover |
| 50 m | ≈18.2% | 3699–3749 m | under overhead cover |
| 100 m | 16.1% | 7021–7121 m |
Map
Check this route yourself: Google Maps route via their router · Street View at the base where coverage exists · geojson.io our exact measured line · OpenTopoMap
No aerial layer here: Britain has no open or government source of aerial photography at road scale — the pan-government APGB imagery is licensed to the public sector only, unlike the LiDAR this survey is measured from. Street View, where it exists, is the visual check.
This climb's data: OCL JSON — the full gradient ladder, quality flags and provenance in the OpenClimb Ladder format.
Measured, not vetted. This page records what the laser record shows about the road's shape — nothing more. Nobody has necessarily ridden or inspected this road for the survey, and a page here is not a recommendation and no guarantee that the road is open, surfaced, rideable or safe. Gates, private sections, missing rights of way and hazards do not show up in elevation data. Check access and conditions on the ground and make your own judgment.
Ridden it, or know better? Submit data for this climb no account needed · Share this climb
Route colour = gradient over a 25 m window: <10% 10–20% 20–25% ≥25%
© OpenStreetMap contributors · topo tiles © OpenTopoMap (CC-BY-SA) · vector tiles OpenFreeMap

Profile
The profile and gradient chart share one position — move your pointer over them and the marker follows. Colors are the gradient bands; the shaded span is the steepest 25 m. Any 25 m figure is good to about a point either way (why).

Reported values vs. measurement
| Source | Claim | Evidence | Best-matching window |
|---|---|---|---|
| Road sign (B6355 at Danskine) | 17% | road_sign | 100 m (+0.9 pp) |
Measurement card
| Elevation | Scottish Remote Sensing Portal (AWS Open Data, srsp-open-data) — Scottish Public Sector LiDAR Phase 3 50cm |
|---|---|
| Resolution / CRS | 0.5 m grid, EPSG:27700; sampled every 1.0 m, bilinear interpolation |
| Tiles | NT56NW, NT56NE |
| Road centreline | OpenStreetMap (local PBF extract), snapshot 2026-08-13T20:21:01Z |
| Quality status | evidence quality U; review flags: short window divergence |
| Analysis | OCL 0.1.0, analysis 0.1.0, run identifier not recorded (legacy measurement, before the campaign driver stamped runs), calculated 2026-08-19 |
Provenance
{
  "analysis_version": "0.1.0",
  "sample_interval_m": 1.0,
  "interpolation": "bilinear",
  "smoothing": "none",
  "gradient_windows_m": [
    5.0,
    10.0,
    20.0,
    25.0,
    50.0,
    100.0
  ],
  "diagnostic_windows_m": [
    2.0,
    3.0
  ],
  "elevation_crs": "EPSG:27700",
  "elevation_resolution_m": 0.5,
  "elevation_tiles": [
    "data/cache/scotland/phase-3/dtm/NT56NW.tif",
    "data/cache/scotland/phase-3/dtm/NT56NE.tif"
  ],
  "calculated_at": "2026-08-19T17:29:56+00:00",
  "road_source": "OpenStreetMap (local PBF extract)",
  "road_attribution": "\u00a9 OpenStreetMap contributors, ODbL",
  "osm_pbf_path": "data/cache/pbf/scotland-2026-08-14.osm.pbf",
  "osm_snapshot": "2026-08-13T20:21:01Z",
  "elevation_provider": "Scottish Remote Sensing Portal (AWS Open Data, srsp-open-data)",
  "elevation_licence": "Open Government Licence v3 \u2014 \u00a9 Scottish Government, SEPA and partners; Crown copyright",
  "elevation_dataset": "Scottish Public Sector LiDAR Phase 3 50cm",
  "elevation_tile_ids": [
    "NT56NW",
    "NT56NE"
  ],
  "climb_origin": "discovered",
  "naming_note": "auto-named from gazetteer (hypothesis, unreviewed); discovered as 'Discovered lane (55.8970, -2.6938)'",
  "license": "ODbL-1.0",
  "license_url": "https://howsteep.org/licensing"
}