Arthur's Pass from Arthur's Pass
3813.3 m · net rise 174.1 m · total ascent 215.9 m · overall 4.6% · evidence quality B (good) · Canterbury · Canterbury · share
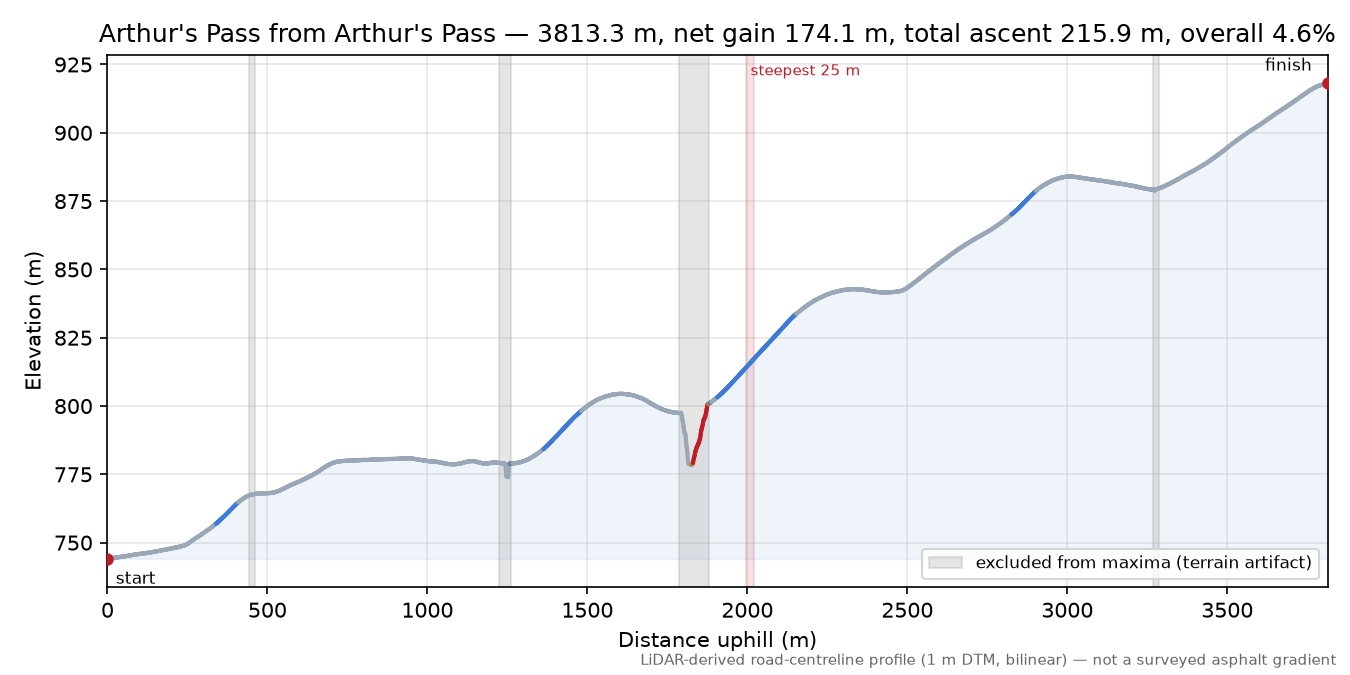
Shape: sustained — 42% of the climbing sits in a quarter of the distance; longest continuous stretch at 10%+ is 252 m.
Not yet matched against documented climbs — the measurement stands on its own.
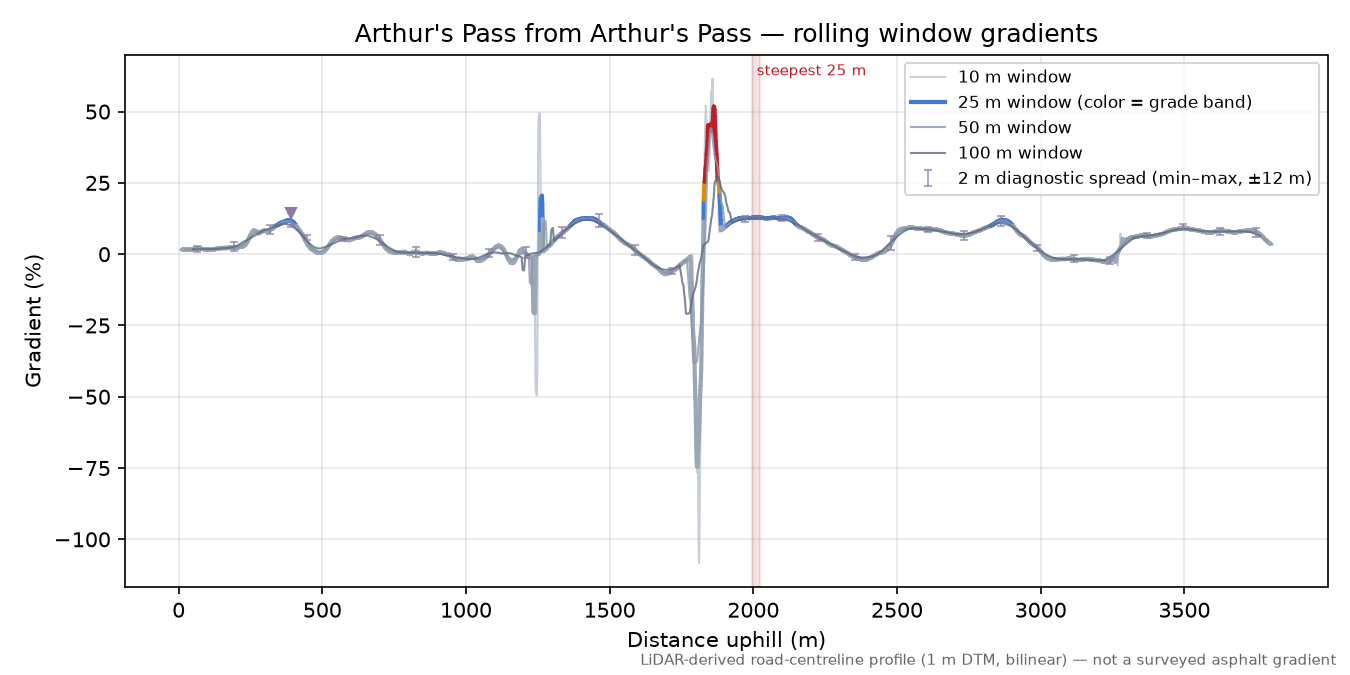
Gradient ladder what do windows mean?
| Window | Maximum | Located at | |
|---|---|---|---|
| 2 m (diagnostic) | ≈14% | 389–391 m | under overhead cover terrain reads 135.1% at 1253–1255 m across a structure — excluded |
| 3 m (diagnostic) | ≈14% | 389–392 m | under overhead cover terrain reads 130.3% at 1253–1256 m across a structure — excluded |
| 5 m | ≈13% | 2115–2120 m | under overhead cover terrain reads 98.6% at 1252–1257 m across a structure — excluded |
| 10 m | ≈13% | 2115–2125 m | under overhead cover terrain reads 61.5% at 1853–1863 m across a structure — excluded |
| 20 m | ≈13.0% | 2002–2022 m | under overhead cover terrain reads 51.1% at 1853–1873 m across a structure — excluded |
| 25 m | ≈13.0% | 1997–2022 m | under overhead cover terrain reads 51.8% at 1850–1875 m across a structure — excluded |
| 50 m | ≈12.8% | 1985–2035 m | under overhead cover terrain reads 44.1% at 1829–1879 m across a structure — excluded |
| 100 m | ≈12.8% | 1985–2085 m | under overhead cover terrain reads 26.9% at 1829–1929 m across a structure — excluded |
Map
Check this route yourself: Google Maps route via their router · Street View at the base where coverage exists · geojson.io our exact measured line · OpenTopoMap
This climb's data: OCL JSON — the full gradient ladder, quality flags and provenance in the OpenClimb Ladder format.
Surface: paved throughout, according to LINZ Topo50 road centrelines.
Measured, not vetted. This page records what the laser record shows about the road's shape — nothing more. Nobody has necessarily ridden or inspected this road for the survey, and a page here is not a recommendation and no guarantee that the road is open, surfaced, rideable or safe. Gates, private sections, missing rights of way and hazards do not show up in elevation data. Check access and conditions on the ground and make your own judgment.
Ridden it, or know better? Submit data for this climb no account needed · Share this climb
Route colour = gradient over a 25 m window: <10% 10–20% 20–25% ≥25%
© OpenStreetMap contributors · topo tiles © OpenTopoMap (CC-BY-SA) · vector tiles OpenFreeMap

Profile
The map, profile and gradient chart share one position — move your pointer over them and the marker follows. Colors are the gradient bands; the shaded span is the steepest 25 m. Any 25 m figure is good to about a point either way (why).
Measurement card
| Elevation | LINZ nz-elevation — New Zealand 1 m DEM/DSM national LiDAR mosaic — Toitū Te Whenua Land Information New Zealand (LINZ), vertical datum NZVD2016 (LINZ documentation; not re-verified against a benchmark) |
|---|---|
| Resolution / CRS | 1.0 m grid, EPSG:2193; sampled every 1.0 m, bilinear interpolation |
| Tiles | BV20 |
| Road centreline | OpenStreetMap (local PBF extract) |
| Quality status | evidence quality B; caveated windows: structure excluded, structure excluded min |
| Analysis | OCL 0.1.0, analysis 0.1.0, run nz-s2, calculated 2026-09-28 |
Provenance
{
  "analysis_version": "0.1.0",
  "run_manifest": {
    "manifest_version": "1",
    "code_git_sha": "f5ccc1713da600fbea2ba1433fb64f96644949ee",
    "code_git_dirty": "false",
    "analysis_version": "0.1.0",
    "analysis_config_digest": "sha256:8c94015b54267da4",
    "python": "3.14.4",
    "numpy": "2.5.3",
    "rasterio": "1.5.1",
    "pyproj": "3.8.0",
    "laspy": "2.7.0",
    "shapely": "2.1.2",
    "pyosmium": "4.3.1",
    "libosmium": "2.23.1",
    "gdal": "3.12.4",
    "proj": "9.8.1",
    "run_id": "nz-s2",
    "road_pbf": "block-batch-nz-s2.osm.pbf",
    "region_key": "nz",
    "crs": "EPSG:2193",
    "elevation_provider_key": "nz-linz",
    "tile_index": "stac",
    "authority": "linz",
    "registry_pbf": "new-zealand-2026-09-26.osm.pbf",
    "tile_index_snapshot": "sha256:996c8a61eaf9687f"
  },
  "sample_interval_m": 1.0,
  "interpolation": "bilinear",
  "smoothing": "none",
  "gradient_windows_m": [
    5.0,
    10.0,
    20.0,
    25.0,
    50.0,
    100.0
  ],
  "diagnostic_windows_m": [
    2.0,
    3.0
  ],
  "elevation_crs": "EPSG:2193",
  "elevation_resolution_m": 1.0,
  "elevation_tiles": [
    "data/cache/nz/BV20.tiff"
  ],
  "calculated_at": "2026-09-28T05:20:19+00:00",
  "road_source": "OpenStreetMap (local PBF extract)",
  "road_attribution": "\u00a9 OpenStreetMap contributors, ODbL",
  "osm_pbf_path": "data/cache/pbf/block-batch-nz-s2.osm.pbf",
  "osm_snapshot": "",
  "run_id": "nz-s2",
  "elevation_provider": "LINZ nz-elevation",
  "elevation_licence": "CC BY 4.0 \u2014 Toit\u016b Te Whenua Land Information New Zealand \u2014 https://nz-elevation.s3.ap-southeast-2.amazonaws.com/LICENSE",
  "elevation_dataset": "New Zealand 1 m DEM/DSM national LiDAR mosaic \u2014 Toit\u016b Te Whenua Land Information New Zealand (LINZ), vertical datum NZVD2016 (LINZ documentation; not re-verified against a benchmark)",
  "elevation_tile_ids": [
    "BV20"
  ],
  "climb_origin": "named-pass",
  "seam_filled_samples": {
    "count": 0,
    "distances_m": []
  },
  "seam_filled_in_maximum": false,
  "structure_own_ways": 18,
  "structure_mask_ranges_m": [
    [
      448.0,
      455.8
    ],
    [
      1242.0,
      1255.6
    ],
    [
      1790.3,
      1874.0
    ],
    [
      3272.8,
      3281.7
    ]
  ],
  "mask_basin_extension_m": 13.0,
  "carriageway": {
    "stations": 159,
    "stations_resolved": 159,
    "width_median_m": 9.5,
    "width_p10_m": 6.65,
    "width_min_m": 2.25,
    "width_max_m": 12.0,
    "bounded_share": 0.063,
    "unbounded_share": 0.937,
    "confidence_median": 0.0,
    "width_median_bounded_m": 7.0,
    "window_m": [
      1997.0,
      2022.0
    ],
    "width_at_max25_m": 10.5,
    "window_stations": 7,
    "single_track": false,
    "single_track_rule": "PROVISIONAL (2026-09-15): width_p10_m <= 3.0 m with bounded_share >= 0.6; recorded, not a rule",
    "status": "ok",
    "source": "dtm",
    "station_m": 25.0,
    "window_station_m": 5.0,
    "halfwidth_m": 6.0,
    "step_m": 0.25,
    "level_tol_m": 0.12,
    "break_min_m": 0.3,
    "stations_failed": 0,
    "hedge_to_hedge": {
      "stations": 159,
      "stations_resolved": 159,
      "width_median_m": 10.25,
      "width_p10_m": 4.75,
      "width_min_m": 0.75,
      "width_max_m": 12.0,
      "bounded_share": 0.421,
      "unbounded_share": 0.579,
      "confidence_median": 0.0,
      "width_median_bounded_m": 7.25,
      "window_m": [
        1997.0,
        2022.0
      ],
      "width_at_max25_m": 11.75,
      "window_stations": 7,
      "status": "ok",
      "source": "dsm",
      "station_m": 25.0,
      "window_station_m": 5.0,
      "halfwidth_m": 6.0,
      "step_m": 0.25,
      "level_tol_m": 0.5,
      "break_min_m": 0.3,
      "stations_failed": 0
    }
  },
  "license": "ODbL-1.0",
  "license_url": "https://howsteep.org/licensing"
}