Trinity View
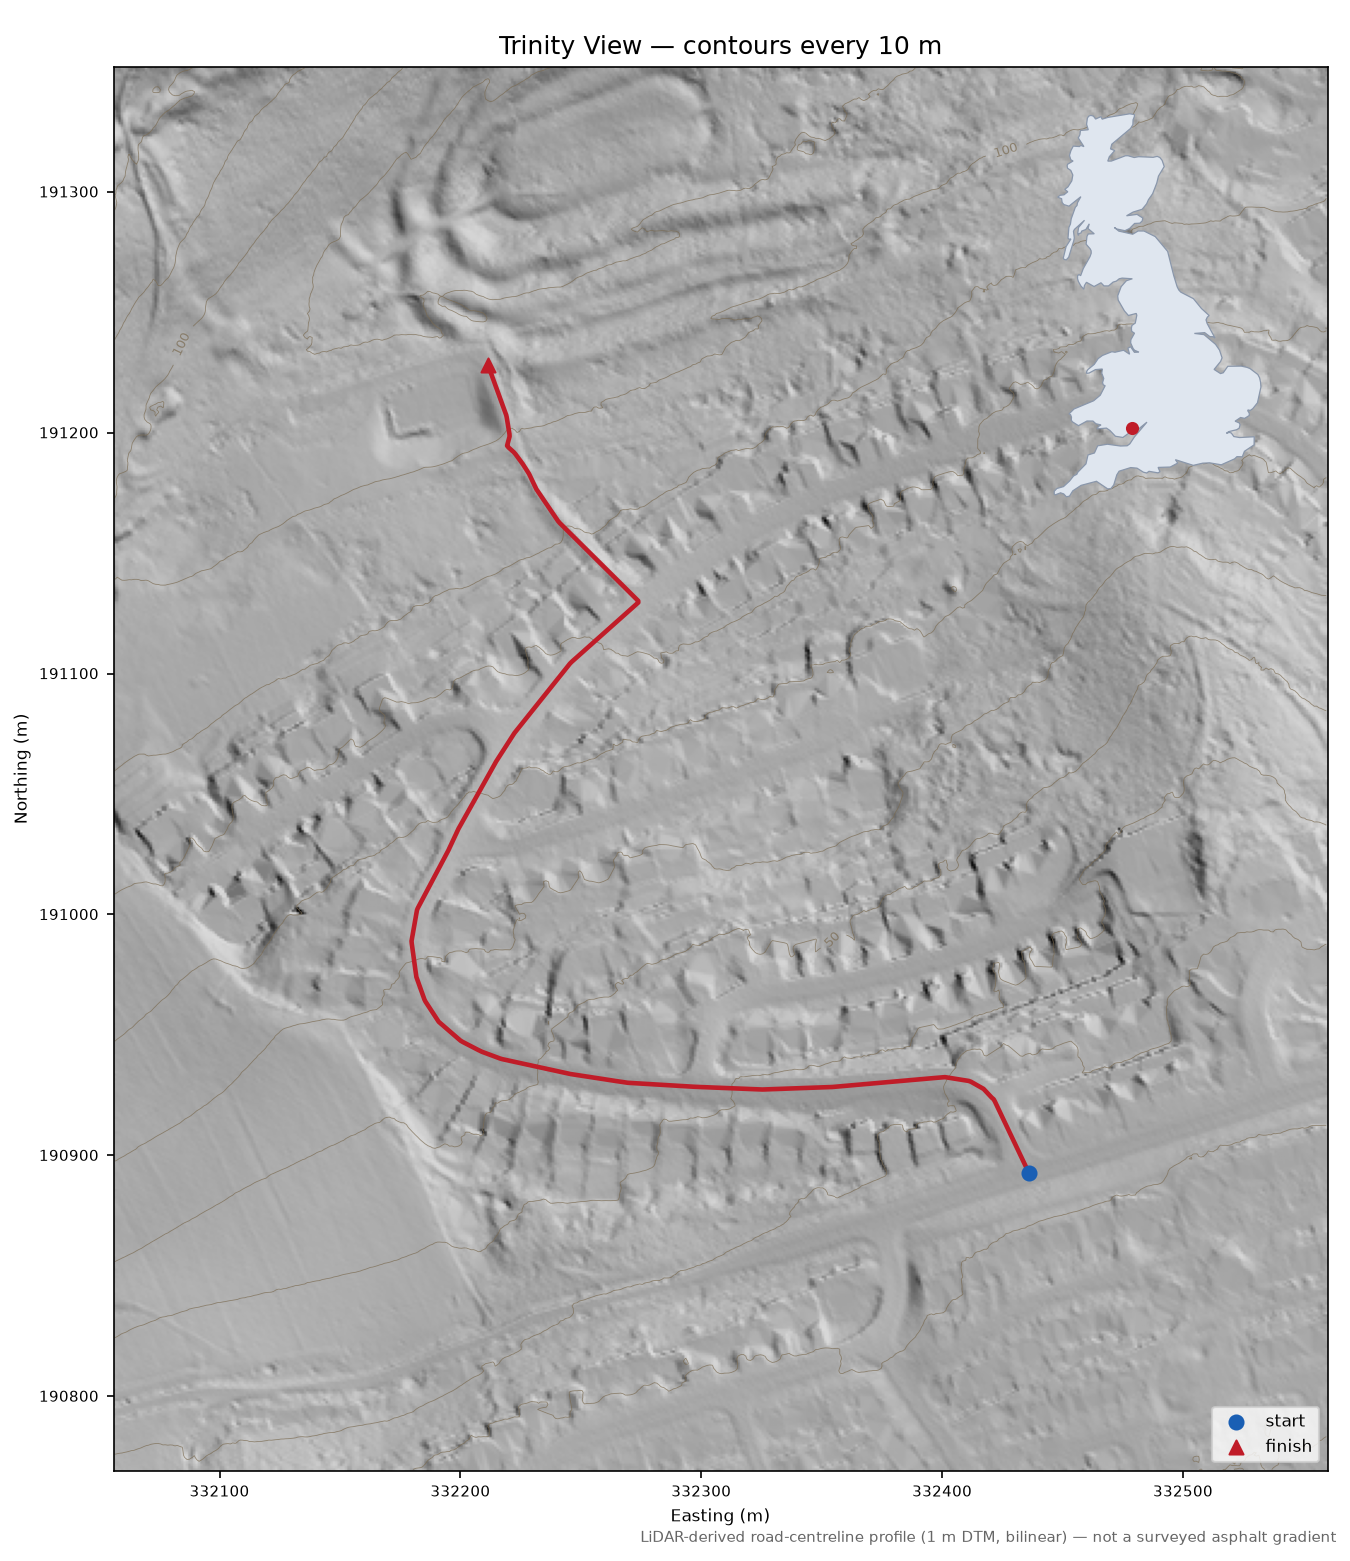
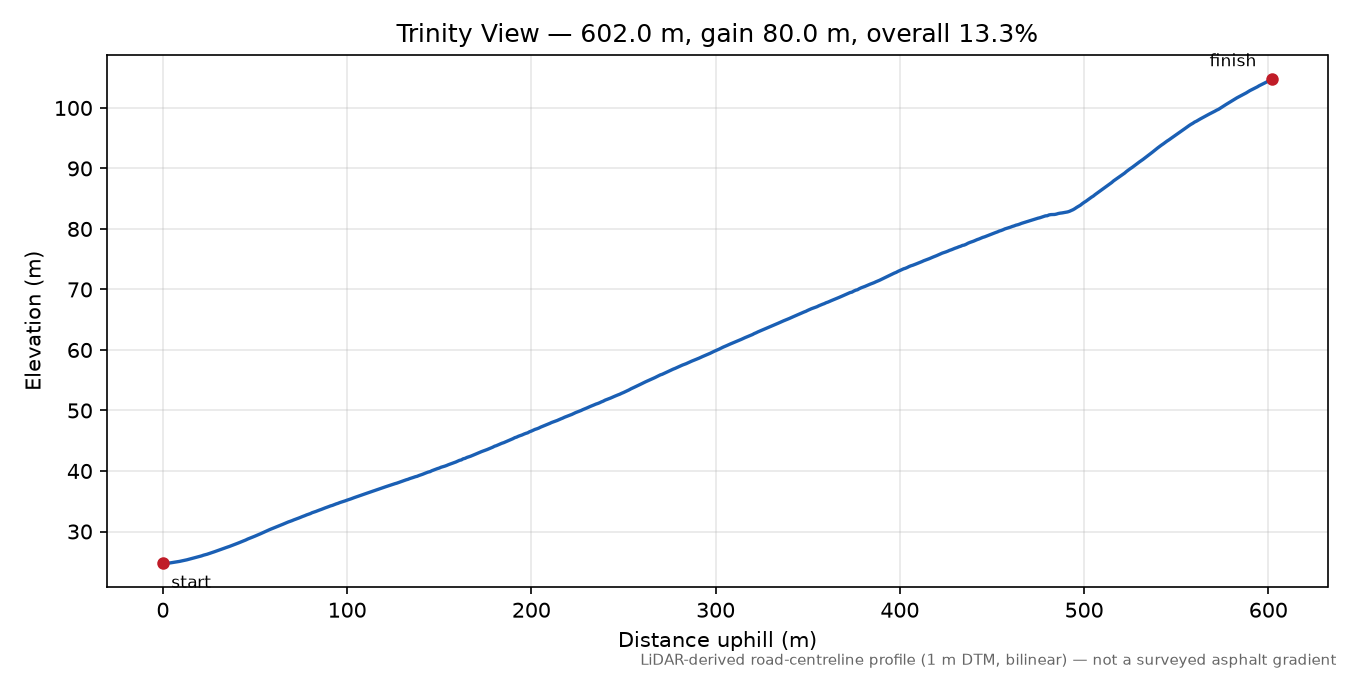
602.0 m · gain 80.0 m · overall 13.3% · Pilton Vale · Casnewydd - Newport
Shape: sustained — 32% of the climbing sits in a quarter of the distance; longest continuous stretch at 10%+ is 350 m.
Documented on the ground — tag: 40% (2026). Signs get repainted and tags get retagged, so the date is part of the fact; on no cycling list we know of.
≈ Overhead cover (tree canopy or structures) spans 6% of this route — detected by comparing the surface model (DSM, treetops and rooftops) against the terrain model (DTM, bare ground). Under cover the bare-ground model is built from fewer laser returns, so metre-scale readings can wobble; maxima whose window sits in a covered zone are marked ≈ below — less certain, not wrong. Longer windows average over more clean ground and are steadier.
Gradient ladder what do windows mean?
| Window | Maximum | Located at | |
|---|---|---|---|
| 2 m (diagnostic) | 24.8% | 534–536 m | |
| 3 m (diagnostic) | 24.5% | 537–540 m | |
| 5 m | 24.4% | 534–539 m | |
| 10 m | 23.6% | 534–544 m | |
| 20 m | ≈23.1% | 522–542 m | under overhead cover |
| 25 m | ≈22.9% | 515–540 m | under overhead cover |
| 50 m | ≈22.4% | 498–548 m | under overhead cover |
| 100 m | ≈20.3% | 495–595 m | under overhead cover |
may_continue_beyond_end Extent detection suggests reviewing where this climb starts/ends.
Map
Check this route yourself: Google Maps route via their router · Street View at the base where coverage exists · geojson.io our exact measured line · OpenTopoMap
© OpenStreetMap contributors · topo tiles © OpenTopoMap (CC-BY-SA) · vector tiles OpenFreeMap
Profile
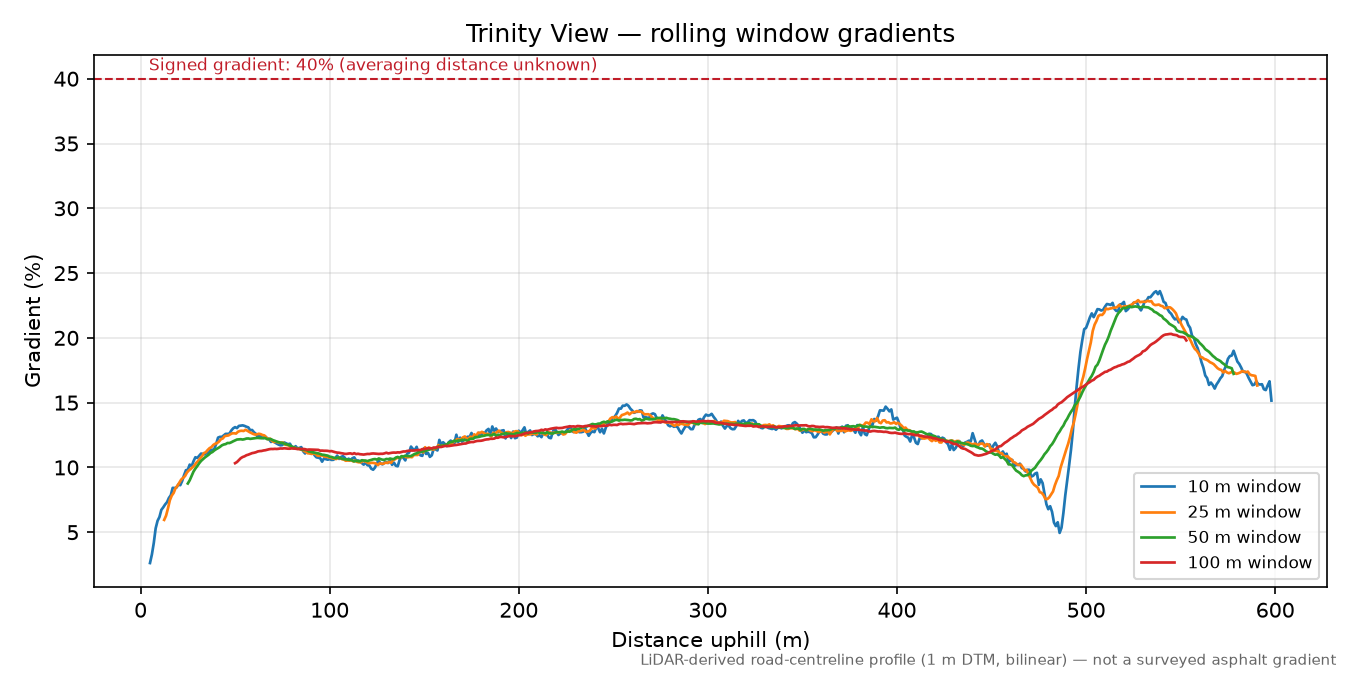
Reported values vs. measurement
| Source | Claim | Evidence | Best-matching window |
|---|---|---|---|
| OSM incline tag (bulk changeset) | 40% | mapper_estimate | 2 m (+15.2 pp) |
Provenance
{
  "analysis_version": "0.1.0",
  "sample_interval_m": 1.0,
  "interpolation": "bilinear",
  "smoothing": "none",
  "gradient_windows_m": [
    5.0,
    10.0,
    20.0,
    25.0,
    50.0,
    100.0
  ],
  "diagnostic_windows_m": [
    2.0,
    3.0
  ],
  "elevation_crs": "EPSG:27700",
  "elevation_resolution_m": 1.0,
  "elevation_tiles": [
    "data/cache/wales/dtm_1m/wg_del_31_332190_20220403dtm.tif",
    "data/cache/wales/dtm_1m/wg_del_5_332191_20201201dtm.tif"
  ],
  "calculated_at": "2026-08-12T09:11:51+00:00",
  "road_source": "OpenStreetMap (local PBF extract)",
  "road_attribution": "\u00a9 OpenStreetMap contributors, ODbL",
  "osm_pbf_path": "data/cache/pbf/wales-2026-08-11.osm.pbf",
  "osm_snapshot": "2026-08-10T20:21:40Z",
  "elevation_provider": "Welsh Government",
  "elevation_dataset": "Welsh Government LiDAR 1m DTM (2020-2023)",
  "elevation_licence": "Open Government Licence v3 \u2014 \u00a9 Crown copyright Welsh Government",
  "elevation_catalogue_layer": "geonode:welsh_government_lidar_tile_catalogue_2020_2023",
  "elevation_tile_ids": [
    "wg_del_31_332190_20220403dtm.tif",
    "wg_del_5_332191_20201201dtm.tif"
  ],
  "elevation_capture_dates": [
    "01-12-2020",
    "03-04-2022"
  ],
  "climb_origin": "osm_incline",
  "signed_gradient_pct": 40,
  "signed_source": "OSM incline tag ONLY \u2014 no evidence of a physical sign. Single bulk changeset 112097443 (2021-10-04, user ZenPhil, comment 'inclines', source 'local knowledge'): 44 incline tags across one Caerleon estate in one edit. Evidence type: mapper estimate, NOT road_sign.",
  "notes": "Measured max 5 m 14.9% vs tagged 40% \u2014 the tag, not the terrain, is wrong. Keep as the canonical example of why OSM incline tags need provenance checks before being treated as sign observations. EXTENDED by graph walk: +0 segment(s) at base, +4 at top (stop: base=no_descending_continuation, top=no_ascending_continuation; min_avg=2.0%). Review before adopting."
}